
Critical Metrics your Financial Dashboards Should Have
As a CFO, it’s your responsibility to utilize data to make informed and strategic decisions for your business. Having a comprehensive understanding of your operational costs and profit margins are just the tip of the iceberg for what you need to be on top of. In the past, businesses would manually maintain and rely on spreadsheets to track financial data, but with the technology available today spreadsheets for financial management should be a thing of the past (hopefully).
An example of that technology, Sage Intacct, the leading cloud financial management software , provides easy-to-use and intuitive financial dashboards from almost any perspective, such as business driver, entity, product or geography. These dashboards provide real-time and immediate insight into financial data, empowering CFOs with the information they need without needing to spend hours updating and creating reports.
Basics of What Your Dashboards Should Look Like
Financial dashboards should give management a snapshot of what’s going on in your business, which in turn should drive action to make changes – whether the information is showing something positive or highlighting issues. What sets dashboards apart from spreadsheets and static printed reports is the ability to interact with the data by drilling into multiple metrics so you have a better understand what’s really happening.
As such, best practices indicate that dashboards should include 8 – 10 key performance indicators (KPIs) that are a mixture of both financial and non-financial metrics, so you can get a well-rounded view of how your business is performing. Some examples of KPIs that should could be included are volume, pricing, shipments, market share, and utilization.1
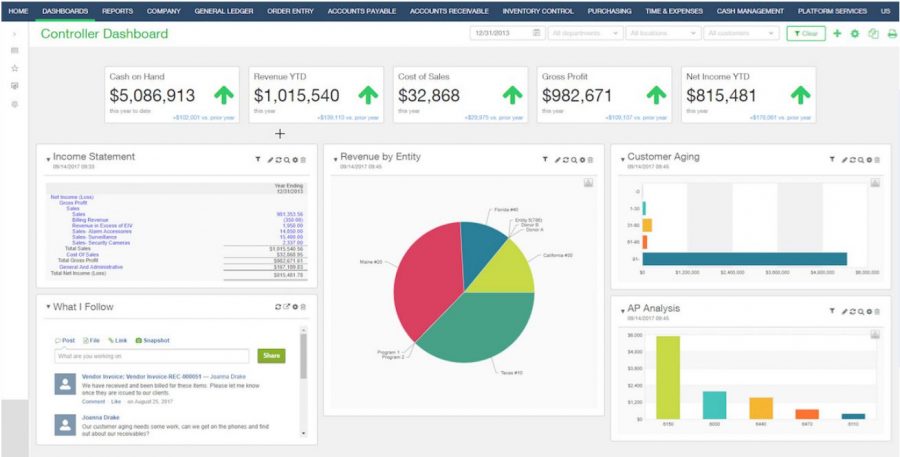
The following screenshot shows a Controller’s dashboard in Sage Intacct with a range of information across different metrics and ways it can be displayed.
10 Critical Dashboard Financial Metrics Every CFO Should Consider for their Dashboard
Unlike KPIs, which are used to measure performance and success, metrics help track performance and progress. Since KPIs vary depending on the company, and while non-financial metrics can be quite straightforward to determine, there are a few financial metrics that are highly specific and very helpful to include. We’ve outlined 10 financial metrics that are widely applicable to CFO’s across the board and regardless of your industry or goals, these metrics are a great place to start when setting up your dashboard. Which financial metrics and how many you include will depend on your KPIs and how detailed you want your dashboard to be.
- Working Capital: the net of asset worth less liabilities, which will show how much capital you have available
- Operating Cash Flow: a running balance of cash flow in the company
- Current Ratio: assets versus liabilities, indicating whether your accounting office and financial system are on track
- Payroll Headcount Ratio: monitoring the type and number of employees in the company, including whether they’re part-time, full-time or contact
- Return on Equity: looks at your finances from the investment perspective versus the operating view
- Quick Ration or Acid Test: flags problems that need to be address quickly or decision changes that need to be made
- Debt to Equity: evaluates your commitments and flags where your business is becoming handicapped by borrowing and credit obligations
- Accounts Receivable Turnover: assent of how quickly revenue from goods and services is being received
- Accounts Payable Turnover: assessment of the rate of accounts payable processing
- Inventory Turnover: how quickly goods are leaving the warehouse and if sales are rising at the same rate because if they’re not, it’s an indication of waste or fraud.3
The specific dashboards you’ll want or need vary for every business, and whether or not you think your business can benefit from all ten of these dashboards, they give you an idea of the sort of information you can track and have access to with the click of a mouse.
Next to the information itself, dashboards offer a great deal of flexibility when it comes to how you want your information to be displayed.
The power lies in your hands, all you need is the right solution to provide you with the tools to create the dashboards you deem most valuable for your business. Figuring out what you need and the best way information should be displayed can feel daunting, but if you’re feeling lost a great first step is speaking with your solutions partner for guidance.
1 https://www.sageintacct.com/cloud-erp/financial-dashboards
2
3